Sharings from mentors
At VLA, mentorship begins with the youth. Students discuss what they want to learn, co-create course ideas, and invite mentors who can help deepen their understanding. Young people frequently give talks themselves—sharing knowledge, skills, and perspectives with peers and younger members.
In addition to parent contributors, VLA also welcomes young professionals and graduate mentors—older youth who are pursuing graduate studies or working in companies, labs, and government institutions. They return to share their academic journeys, career insights, and real-world experience, offering guidance that feels both relatable and aspirational.
Together, these invited mentors and our youth members create a collaborative learning space where generations learn from one another, and where every voice—youth or adult—has something meaningful to offer.
Critical Thinking
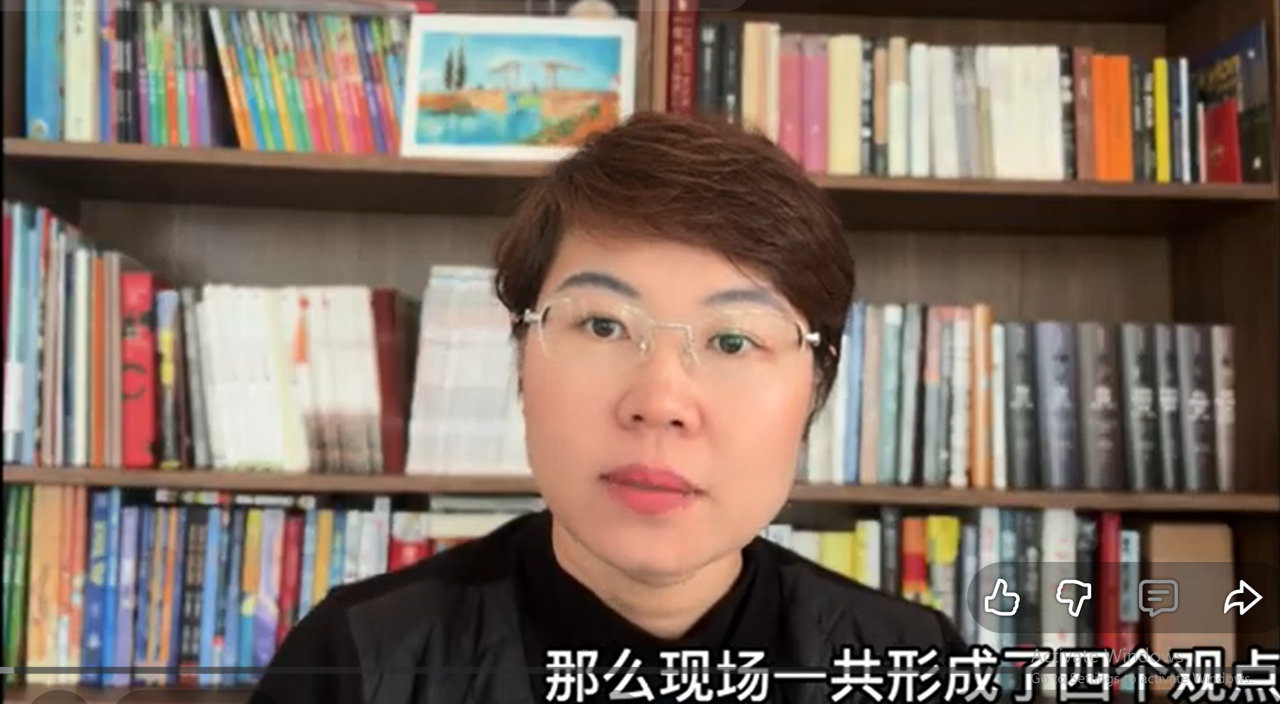
In this episode of Voice Thinking Growth Forum, we invite teenagers and parents to explore a profound question: 👉 “Will humans be replaced by AI?”
Through four perspectives, we uncover three levels of human uniqueness:
🌿 Emotion & Sensibility — The ability to feel and empathize in ways no machine can.
🔥 Free Will & Self-Awareness — The capacity for reflection and conscious choice.
🌍 Cognition & Values — The foundation that shapes our worldview and moral compass.
💡 This video helps young people think deeply about: What truly makes us human in the age of AI? How can our next generation coexist wisely with intelligent technology? How to preserve emotional depth and ethical awareness in a digital world?
AI and the Human Weakness
Artificial intelligence is reshaping how humans think and act — amplifying our weaknesses while quietly eroding what makes us unique.
In this episode, we explore “I, Human”, a thought-provoking book that examines the four defining traits of human nature — bias, narcissism, laziness, and curiosity — and how each evolves in the age of AI.
When algorithms trap us in information bubbles, when AI continuously feeds our vanity and inertia, and when questioning becomes unnecessary — are we losing our ability to think and create?
The video also references a 2024 MIT study revealing that when people use ChatGPT to write, brain engagement and creativity decline significantly.
This is not just a book about AI — it’s a mirror reflecting the essence of humanity.
Join us in reflecting: How can we preserve our uniquely human capacity for thought and curiosity in the age of AI?
Video of 2025 summer session summary
Review of 2025 summer sessions
In an era shaped by AI and information overload, building strong information literacy and data literacy is essential for today’s youth. These abilities are not only foundational life skills but also form the academic groundwork for future studies in Computer Science, Data Science, and related fields.
During the summer of 2025, VLA youth designed and hosted two introductory learning tracks based on the topics they were most eager to explore: AI & Robotics and Data Analysis & Visualization. After identifying what they wanted to learn, youth invited mentors—educators and parents—to contribute their expertise and support.
Mr. Borui Li, from George Brown College in Canada, joined as an invited mentor specializing in robotics, automation, and interdisciplinary teaching. His sessions introduced the history of AI, examined how robotics and AI intersect through frontier areas such as brain–computer interfaces, and engaged youth in discussions about the ethical challenges of technological development. Advanced modules will be offered in the future for students who wish to explore university-level AI, robotics, and automation practice.
Yewen He, known to youth as Teacher Alissa, is a long-time expert in China’s big data industry, a data-competition judge, and a bestselling author in data analytics. Her speeches guided students through the fundamentals of data analysis and visualization, explored global best-practice case studies, and offered hands-on training with Tableau—leading each student to create a complete one-page data dashboard. Future sessions will align with high school Data Management and Statistics curricula, supporting youth who aim to earn the internationally recognized Tableau Data Analyst Certificate.
All sessions were delivered bilingually in English and Chinese, helping students build both technical knowledge and domain-specific vocabulary. Course recordings are now available on VLA’s YouTube channel, where viewers can access previews, reviews, and upcoming content.
This summer initiative reflects VLA’s youth-centered vision: young people take the lead, while adults—parents, mentors, and professionals—participate as invited contributors. Together, they explore new technologies, emerging global trends, and classic works of the humanities, shaping a collaborative space where every participant can learn and grow
Courses Introduction
SESSION 1
What is data visualization?
July 6th, 2025
Introduction to Data Visualization:
Mentor Yewen He introduced the concept of data visualization and explained how it helps people understand data faster than using their brains. Examples and Demonstrations: She used various examples, such as a satisfaction survey table, to demonstrate how data visualization works.
SESSION 2
What is inforgraphic?
July 13rd, 2025
Mentor Yewen He reviewed the content of the last class, focusing on data visualization in Excel. Topics included conditional formatting and formula calculation functions.
Introduction to Infographics: He Yewen introduced the concept of infographics, explaining that they are visually rich and informative.
SESSION 3
How to use Tableau to visualize your data?
August 3rd, 2025
Mentor Yewen He introduced the session and explained that they would be using English due to the software's origin and for easier understanding of dog names.
Yewen He Teacher presented various dog breeds using images and asked participants to guess the breeds. Discussions included characteristics, origins, and suitability for families with children.
She demonstrated how to use Tableau software to visualize data about dog breeds. Participants were guided through opening the software, importing data, and creating visualizations based on different criteria such as size, life expectancy, and friendliness to children.
SESSION 4
Augest 31st, 2025
Mentor Yewen He invited Grade 9 student Celine to share her APP then discussed the importance of building a data story using personal data.
Youngsters discussed that Celine's APP was a great example of data collection.
Yewen He used 3 examples to explain what is a good data story.
Case 1: Emotional Response Survey
Case 2: Stepping in on Up with My Best Friend
Case 3: 115 Moments in Ink
Ever noticed that asking the same question to AI twice can give different answers?
That’s not a bug — it’s by design. To avoid repetitive and mechanical responses, large language models randomly pick from the top probable words instead of always choosing the highest one.
This principle is known as “Top-K sampling” and “temperature,” making answers feel more human.
👉 This highlight is from the full lecture AI and Large Models.
Watch the full version on our channel for deeper insights.
AI models can be divided into two main types:
Generative models: create new content, such as writing poems or generating images.
Discriminative models: classify and judge, like recognizing what’s in a picture.
This simple contrast helps you quickly grasp the core categories of AI.
👉 This highlight is from the full lecture AI and Large Models. Watch the full version on our channel for deeper insights.
How do large language models (LLMs) actually work?
Quite simply: when you type a sentence, the AI predicts the most probable next word based on probability distribution.
For example, given “The cat is on the …”, it may choose mat, table, or roof, depending on which has the highest probability.
This clip reveals the core logic of LLMs with an intuitive example.
👉 This highlight is from the full lecture AI and Large Models. Watch the full version on our channel for deeper insights.
The same word can mean very different things depending on context: “面对面吃面” (face-to-face eating noodles) “背对背搓背” (back-to-back scrubbing) .
This humorous example highlights a key challenge for AI: words must be understood in context and with position. Large models tackle this with “positional encoding.”
👉 This highlight is from the full lecture AI and Large Models.
Watch the full version on our channel for deeper insights.
In this clip, Geoffrey Hinton – the “Godfather of AI” – warns about the immediate risks of AI: surveillance, phishing, and autonomous weapons. He stresses the urgent need for governments and international organizations to act.
More profoundly, he raises the question: when digital intelligence becomes smarter than humans, will we still be in control?
👉 This highlight is from the full lecture AI and Large Models. Watch the full version on our channel for deeper insights.

